Image


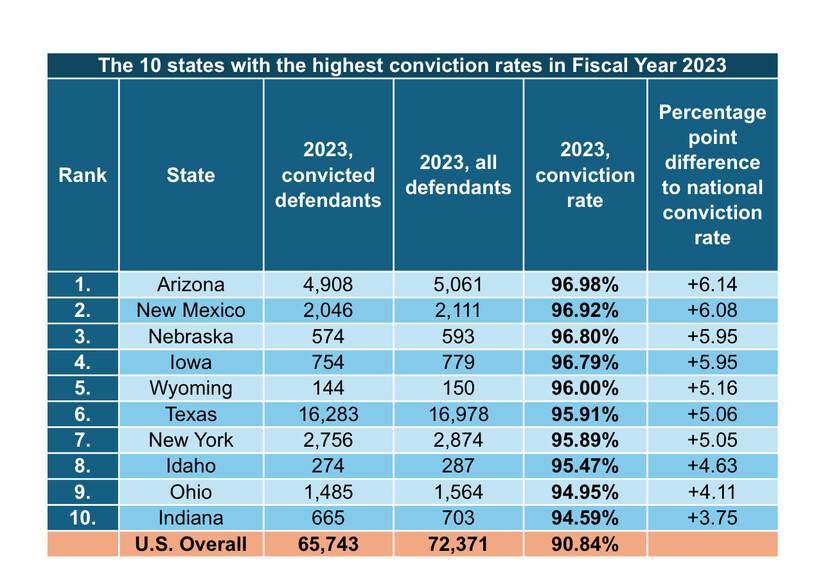
A new study has revealed that New Mexico had America’s second highest conviction rate in 2023.
1. Arizona – 96.98% conviction rate
Arizona had the highest conviction rate in 2023, with 96.98% of criminal defendants receiving a conviction, 6.14 percentage points above the national average of 90.84%. Overall, 4,908 out of its 5,061 criminal defendants received a conviction.
Arizona’s high conviction rate is largely due to the high proportion of criminal defendants who faced immigration charges. Arizona had a 98.5% conviction rate for all immigration charges, and 73.6% of its criminal defendants in 2023 faced an immigration charge. Nationally, defendants with immigration charges faced convictions 97.02% of the time.
2. New Mexico – 96.92% conviction rate
New Mexico had the second highest conviction rate in America, with 96.92% of defendants receiving a conviction, 6.08 percentage points above the national average. In total, 2,046 defendants out of 2,111 received a conviction.
Criminal defendants who faced immigration charges comprised 64% of New Mexico’s total, with a conviction rate of 99.48% for these defendants. Illegal re-entry immigration charges were the most convicted, with 1,005 convictions.
3. Nebraska – 96.8% conviction rate
Nebraska was third, with 96.8% of criminal defendants receiving a conviction, 5.95 percentage points over the average. There were 593 criminal defendants in Nebraska, of which 574 received convictions.
The Cornhusker State’s high conviction rate was partially driven by a 96.83% conviction rate for its most convicted charge, controlled substance – sell, distribute, or dispense. This charge accounted for 244 of Nebraska’s convictions. It was also America's most convicted charge, with 13,934 convictions and 21.19% of all convictions nationally.
4. Iowa – 96.79% conviction rate
Iowa ranked fourth, with 96.79% of criminal defendants facing convictions, 5.95 percentage points above the national average. The Hawkeye State saw 754 out of its 779 criminal defendants convicted. The most convictions in Iowa were for selling, distributing, or dispensing controlled substances, with 313.
5. Wyoming – 96% conviction rate
Wyoming came fifth, with a 96% conviction rate, 5.16 percentage points above the U.S. average of 90.84%. In 2023, 144 out of 150 criminal defendants received convictions. Controlled substance charges accounted for 34 of the Equality State’s convictions, the state’s most convicted charge.
6. Texas – 95.91% conviction rate
Texas had America’s sixth highest conviction rate, at 95.91%, 5.06 percentage points above the national average. The Lone Star State had 16,978 defendants, of whom 16,283 received convictions. Texas had America’s highest number of criminal defendants, nearly three times as many as California, which had the second highest number of defendants, 5,846.
Illegal re-entry under immigration laws was Texas’s most convicted charge, with 7,384 convictions, at a rate of 98.66%. In general, 62% of Texas’s defendants faced an immigration charge, with these defendants being convicted 98.74% of the time.
7. New York – 95.89% conviction rate
New York came seventh, with a conviction rate of 95.89%, 5.05 percentage points over the average of 90.84%. The Empire State convicted 2,756 out of 2,874 of its criminal defendants. Controlled substance charges were New York’s most convicted charge, with 433 convictions, at a rate of 98.63%.
8. Idaho – 95.47% conviction rate
Idaho had America’s eighth highest conviction rate, at 95.47%, 4.63 percentage points above the national average. Overall, 274 out of Idaho’s 287 criminal defendants were convicted. Controlled substance charges accounted for 122 of these convictions, the Gem State’s most convicted charge.
9. Ohio – 94.95% conviction rate
Ohio was ninth, with a conviction rate of 94.95%, 4.11 percentage points more than the American average. There were 1,564 criminal defendants, and 1,485 of them were convicted. Controlled substance charges were the most convicted in the Buckeye State, with 563 convictions.
10. Indiana – 94.59% conviction rate
Indiana ranked tenth, with a 94.59% conviction rate, 3.75 percentage points above the average of 90.84%. There were 703 defendants, and 665 of them were convicted. Controlled substance charges were Indiana’s most convicted, with 216 convictions.
50. Maryland – 39.08% conviction rate
Maryland had the lowest conviction rate in America in 2023. Out of 1,699 criminal defendants, 664 received a conviction, a rate of 39.08% and 51.76 percentage points below the national average of 90.84%.
The Free State’s low conviction rate comes from its high proportion of criminal defendants who faced charges for traffic offenses, other. Maryland classifies certain driving offenses as criminal offenses, whereas other states are less likely to do so.
Maryland had 842 defendants face charges for traffic offenses, other, with only 126 receiving convictions, a rate of 14.96%. Nearly half (49.6%) of all criminal defendants in the state faced this charge, and over half (55.5%) of all defendants that faced this charge nationally were in Maryland.

Data is correct as of October 22, 2024.
Note: U.S. Overall figures include statistics for D.C. and U.S. territories.